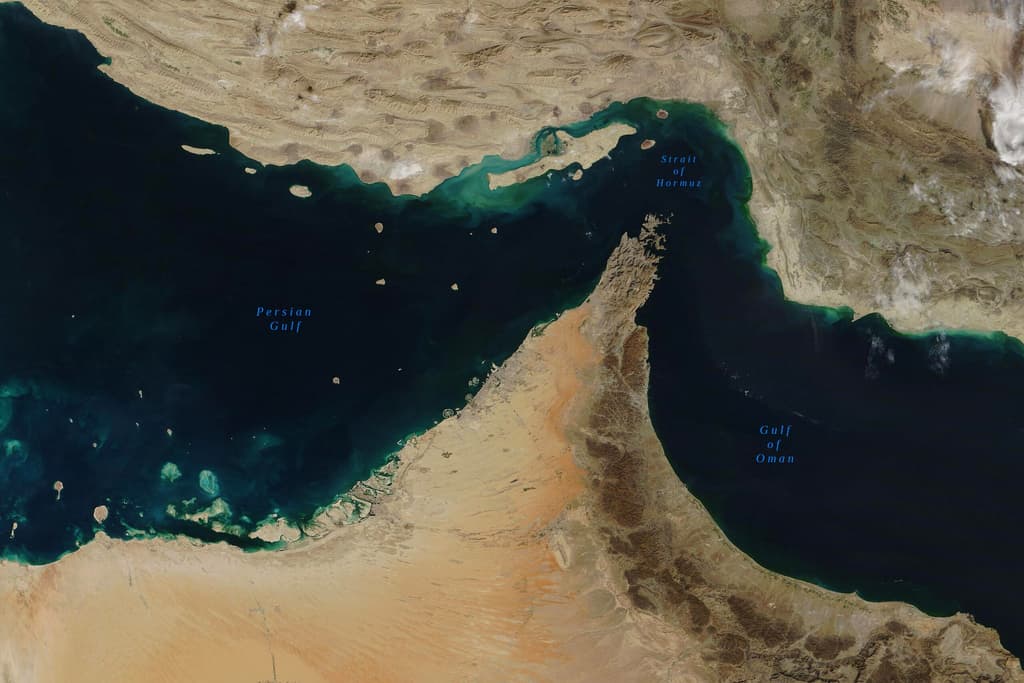
The expiration of the June US-Iran memorandum on August 17 and subsequent reimposition of a U.S. naval blockade have driven a sharp contraction in Strait of Hormuz transits, with daily commercial crossings falling into single digits amid Iranian strikes, elevated war-risk premiums at roughly 40 times normal levels, and widespread rerouting by major carriers. Recent Kpler and IMF PortWatch data show mid-August weekly totals near 73 or lower against a pre-crisis baseline of approximately 73 per day, with most movements occurring via dark or facilitated southern corridors rather than open routes. These conditions underpin the 72% market-implied probability on the 25-49 bin while supporting the 21.5% odds on fewer than 25, as insurance costs and sanctions exposure continue to suppress visible traffic ahead of any potential diplomatic or military de-escalation.
Experimental AI-generated summary referencing Polymarket data. This is not trading advice and plays no role in how this market resolves. · UpdatedHow many ships transit the Strait of Hormuz week of August 17?
How many ships transit the Strait of Hormuz week of August 17?
25-49 72%
<25 22%
50-74 6.9%
75-99 2.1%
$46,997 Vol.
$46,997 Vol.
<25
22%
25-49
72%
50-74
7%
75-99
2%
100+
1%
25-49 72%
<25 22%
50-74 6.9%
75-99 2.1%
$46,997 Vol.
$46,997 Vol.
<25
22%
25-49
72%
50-74
7%
75-99
2%
100+
1%
Transit calls include container, dry bulk, roll-on/roll-off, general cargo, and tanker ships. Ships not reported by IMF Portwatch will not be considered.
This market will resolve as soon as all relevant data has been published. If the relevant data is not published within 14 calendar days of the specified date, this market will resolve based on the most recent data published up to that point.
In case of obvious data integrity issues (i.e., erroneous data), the market may remain open until the end of the third calendar day (ET) after the date on which such data is first released to allow for corrections. Data integrity issues refer only to clerical or other similar errors in the underlying data, and do not include cases where IMF Portwatch differs from alternative sources.
Only revisions to previously published data points made before all relevant data has been published will be considered.
The resolution source for this market will be IMF Portwatch, specifically the transit calls data published for the Strait of Hormuz at https://portwatch.imf.org/pages/cb5856222a5b4105adc6ee7e880a1730, both in the chart and through downloadable files.
Market Opened: Aug 14, 2026, 4:50 PM ET
Resolver
0x69c47De9D...Transit calls include container, dry bulk, roll-on/roll-off, general cargo, and tanker ships. Ships not reported by IMF Portwatch will not be considered.
This market will resolve as soon as all relevant data has been published. If the relevant data is not published within 14 calendar days of the specified date, this market will resolve based on the most recent data published up to that point.
In case of obvious data integrity issues (i.e., erroneous data), the market may remain open until the end of the third calendar day (ET) after the date on which such data is first released to allow for corrections. Data integrity issues refer only to clerical or other similar errors in the underlying data, and do not include cases where IMF Portwatch differs from alternative sources.
Only revisions to previously published data points made before all relevant data has been published will be considered.
The resolution source for this market will be IMF Portwatch, specifically the transit calls data published for the Strait of Hormuz at https://portwatch.imf.org/pages/cb5856222a5b4105adc6ee7e880a1730, both in the chart and through downloadable files.
Resolver
0x69c47De9D...The expiration of the June US-Iran memorandum on August 17 and subsequent reimposition of a U.S. naval blockade have driven a sharp contraction in Strait of Hormuz transits, with daily commercial crossings falling into single digits amid Iranian strikes, elevated war-risk premiums at roughly 40 times normal levels, and widespread rerouting by major carriers. Recent Kpler and IMF PortWatch data show mid-August weekly totals near 73 or lower against a pre-crisis baseline of approximately 73 per day, with most movements occurring via dark or facilitated southern corridors rather than open routes. These conditions underpin the 72% market-implied probability on the 25-49 bin while supporting the 21.5% odds on fewer than 25, as insurance costs and sanctions exposure continue to suppress visible traffic ahead of any potential diplomatic or military de-escalation.
Experimental AI-generated summary referencing Polymarket data. This is not trading advice and plays no role in how this market resolves. · Updated
Beware of external links.
Beware of external links.
Frequently Asked Questions